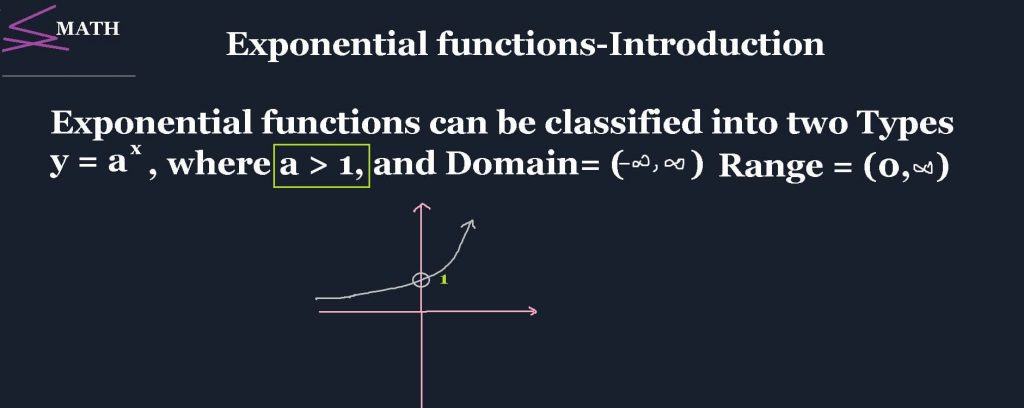
This above function is an example for Exponential growth, meaning, the function is growing very Rapidly after a slow start.
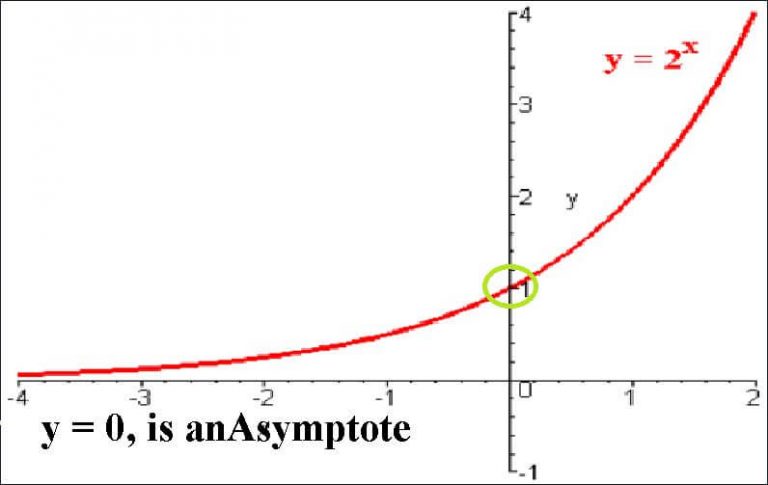
Exponential functions will always have an Asymptote. Here y=0, is an Asymptote.
Type II
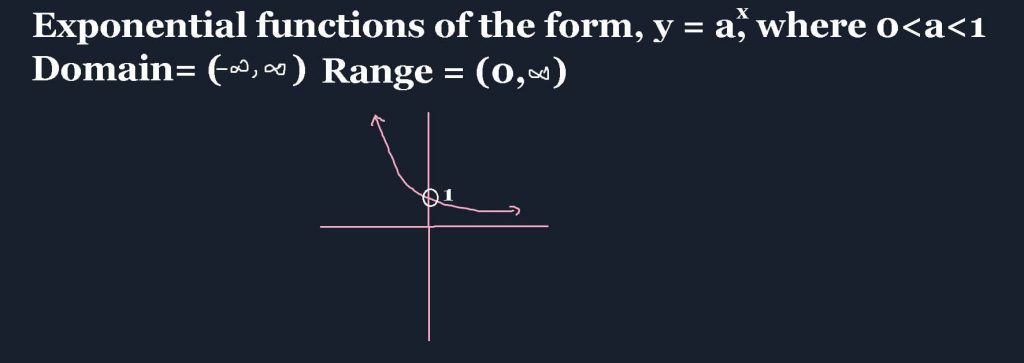
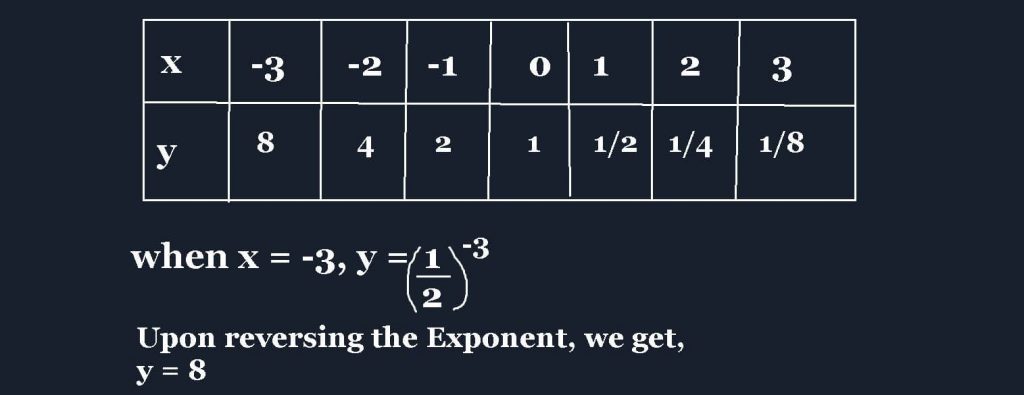
The above function is an example for Exponential decay, where the function reduces rapidly. The Asymptote for this function is also, y=0
Problem

Solution
Problem

Solutions
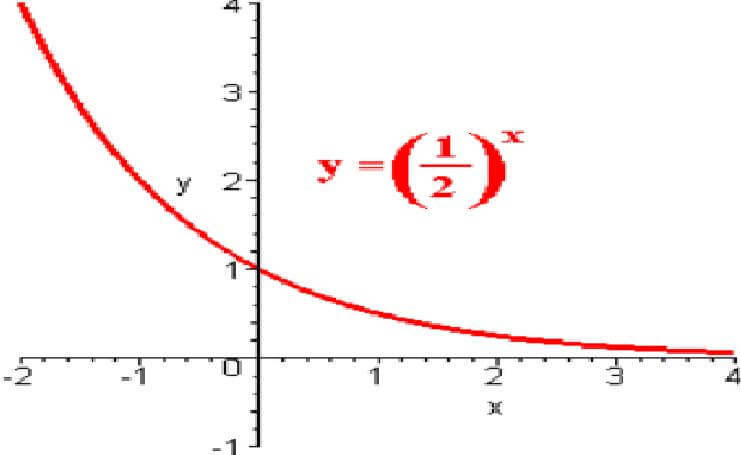
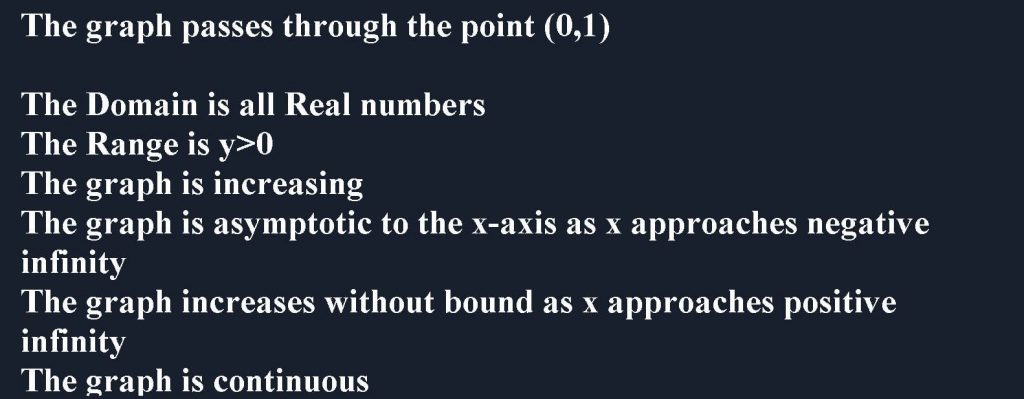
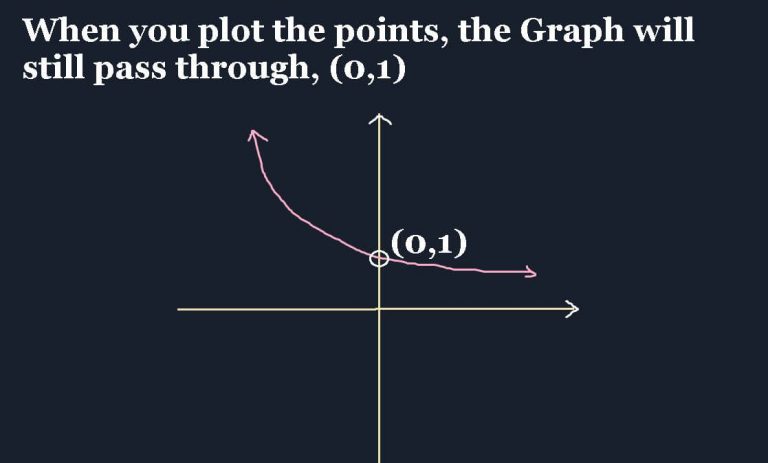
The graph of function y=2-x is shown above. The properties of the exponential function and its graph when the base is between 0 and 1 are given.
- The line passes through the point (0,1)
- The Domain consists of all real numbers
- The Range consists of all y>0
- The Graph represents a decreasing function
- The Graph is Asymptotic to the x-axis (y=0)
- As x approaches positive infinity, the functions heads to zero
- The line increases without bound as x approaches negative infinity
- It is a continuous Graph
- There are no breaks in the Graph.
Questions to think ??
Why we dont take the value of a = 1 or any Negative values? Leave your replies in the comment box

Solution
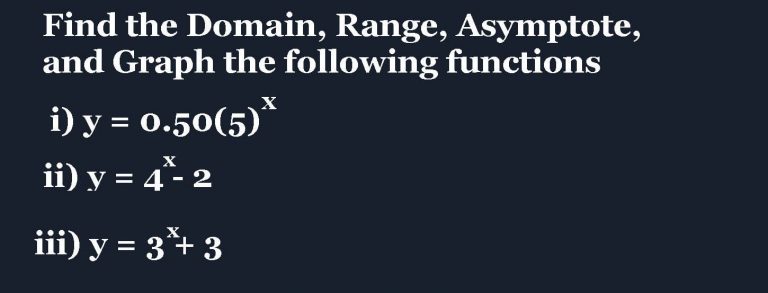
We have already learned how to graph the function without the presence of 3. In this question the number 3 (it is called the Stretch) will slightly Stretch the Graph from its Original point.
Foremost, let us draw the following table for values of x, as follows, and then plot the points for the Graph
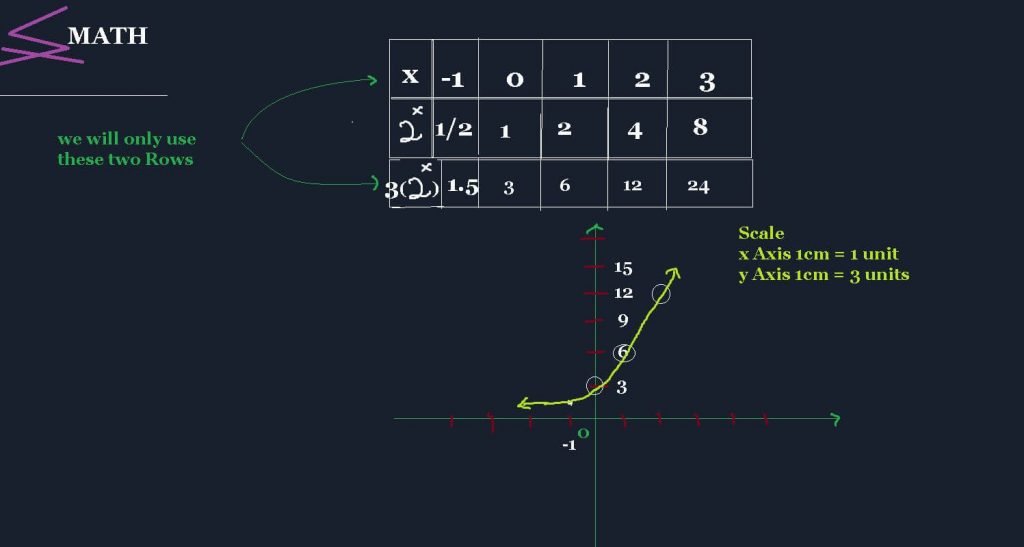
Domain: All Real Numbers
Range: All y>0
Also y = 0 , is an Asymptote for the Graph
Question 2

As always, let us design the table for this function, taking values for x = -1,0,1,2,3,4

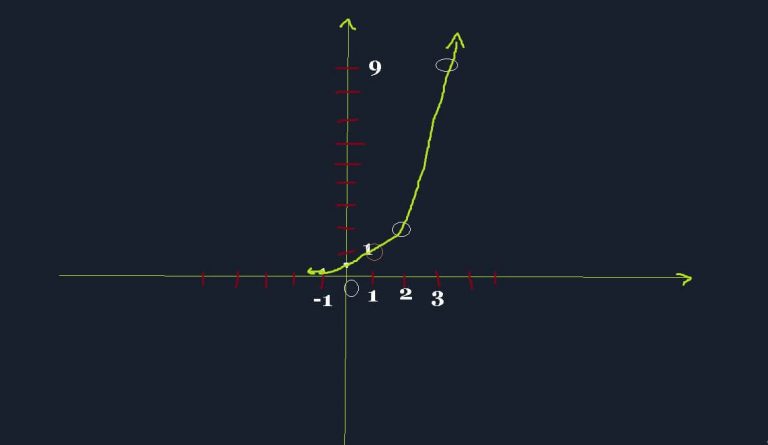
Domain: All Real numbers
Range: All y>0
y=0, will still be an Asymptote for this graph


Try these Questions
Problem

Solution


Try the following questions on Exponential functions
Simplify the following


